Protocol Exercisers & Analyzers
QSPI Protocol Exerciser and Analyzer
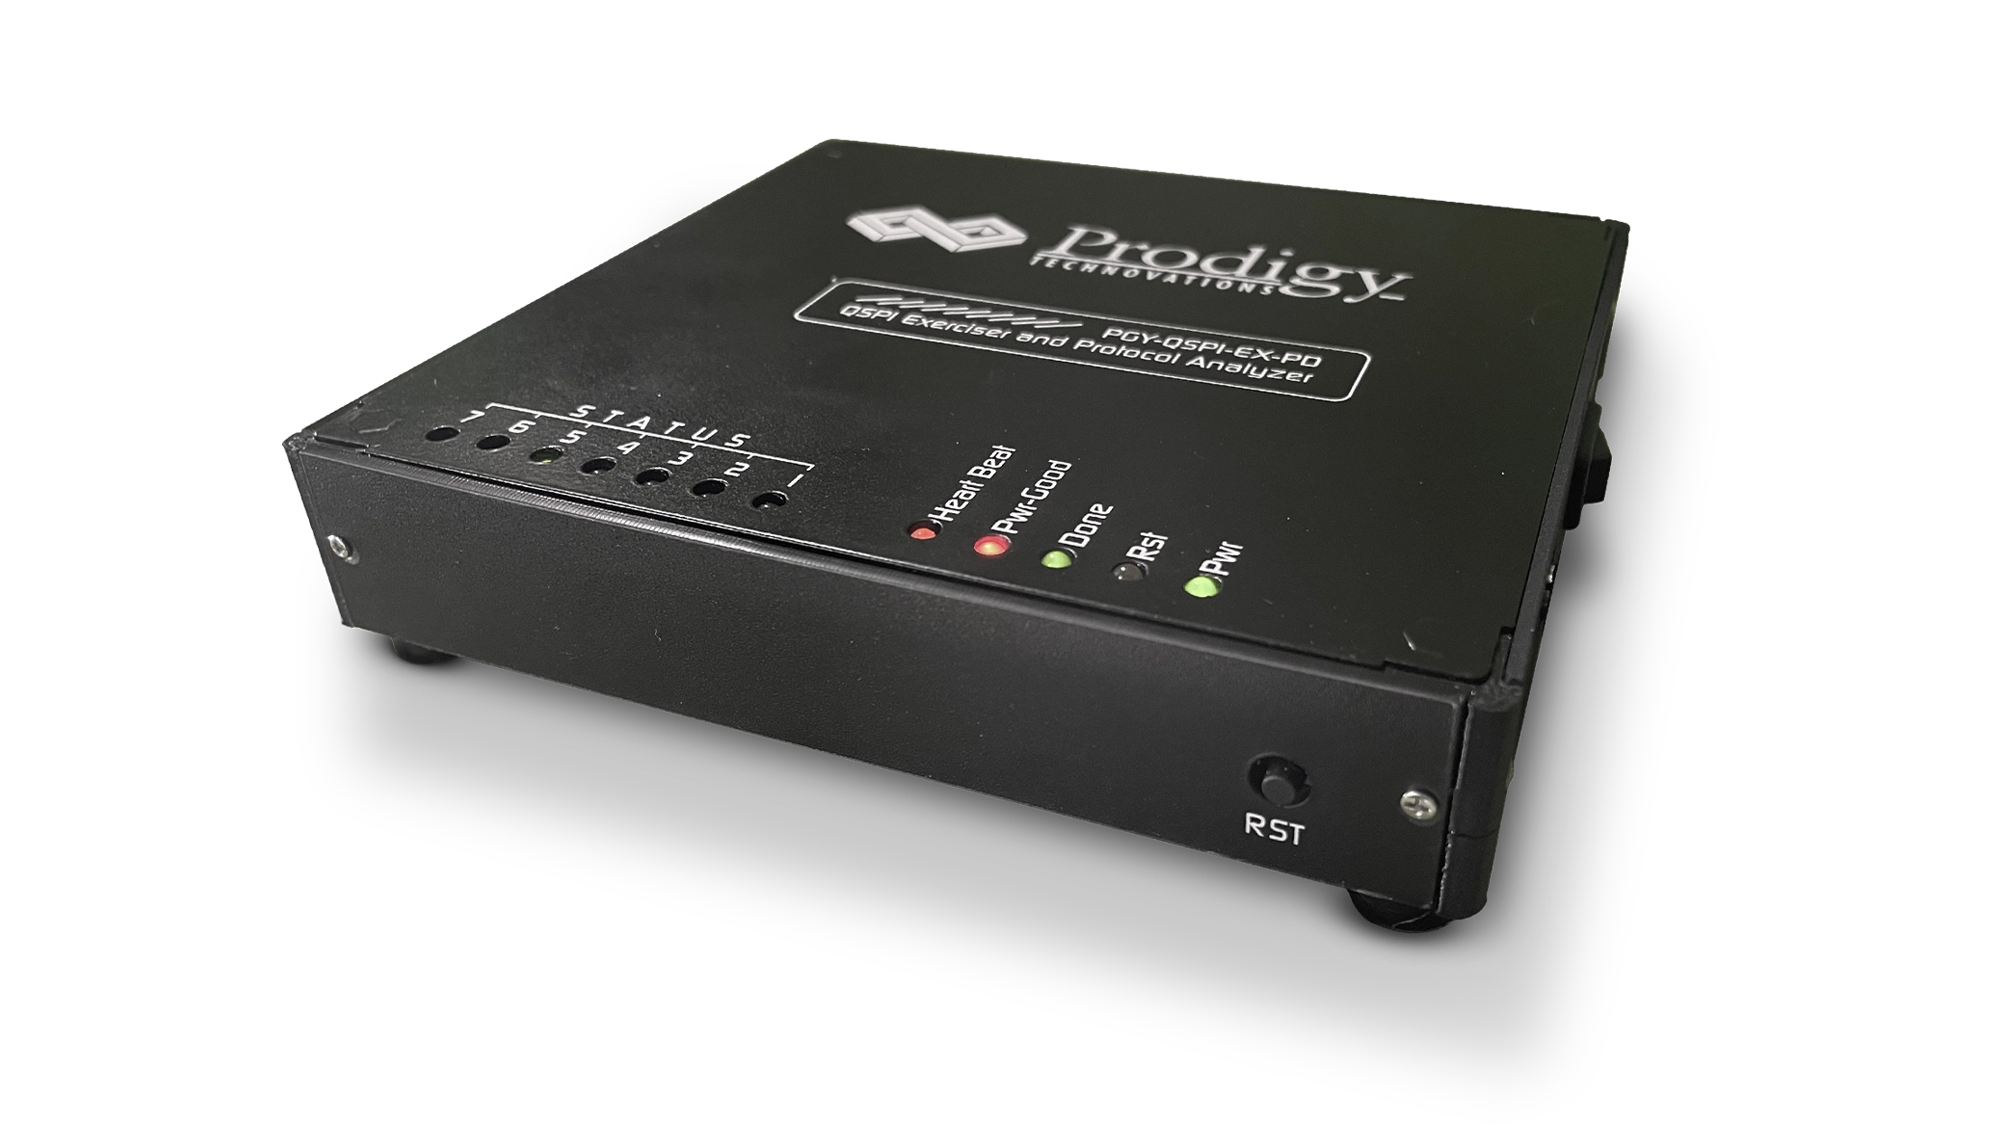
Model No: PGY-QSPI-EX-PD
QSPI Protocol Analyzer (PGY-QSPI-EX-PD) is the Protocol Analyzer with multiple features to capture and debug communication between the host and design under test. PGY-QSPI-EX-PD is the leading instrument that enables the design and test engineers to test the respective QSPI designs for their specifications by configuring the PGY-QSPI-EX-PD as Master/Slave, generating QSPI traffic, and decoding the QSPI protocol decode packets.
PGY-QSPI-EX-PD is the leading instrument that enables the design and test engineers to test the QSPI designs for its specifications by configuring PGY-QSPI-EX-PD as master/slave, generating QSPI traffic with error injection capability and decoding QSPI Protocol packets.
- QSPI
 Free Online Technical Support
 Free Software Updates
 Global Sales Support
 Evaluation Units Available
- Key Features
- Specifications
- Technical Library
- Supports QSPI speeds of up to 80MHz
- Ability to configure it as Master or Slave
- Simultaneously generate QSPI traffic and Protocol decode of the Bus
- QSPI Master and Slaves
- STR and DTR Transfer rates
- Extended, Dual, and Quad QSPI Modes Supported
- Variable QSPI data speeds and duty cycle
- Continuous streaming of protocol data to the host computer to provide a large buffer
- A timing diagram of Protocol decoded bus
- Listing view of Protocol activity
- Error Analysis in Protocol Decode
- Ability to write exerciser script to combine multiple data frame generation at different data speeds
- USB 2.0/3.0 host computer interface
- API support for automation in Python or C++

Exerciser
PGY-QSPI-EX-PD supports QSPI traffic generation using GUI and Script. Users can generate simple traffic generation using the GUI to test the DUT. Script-based GUI provides flexibility to emulate the complete expected traffic in the real-world including error injections. In this sample script user can generate QSPI traffic as below:
Script Line #1: PAGE_PROGRAM
Script Line #2: FAST_READ
Script Line #3: PAGE_PROGRAM
Script Line #4: FAST_READ
Script Line #5: SECTOR_ERASE
Script Line #6: FAST_READ


Multi-Domain view

Multi-domain View provides the complete view of QSPI Protocol activity in a single GUI. Users can easily set up the analyzer to generate QSPI traffic using a GUI or script. Users can capture Protocol activity at specific events and decode the transition between Master and Slave. The decoded results can be viewed in the timing diagram and Protocol listing window with autocorrelation. This comprehensive view of information makes it the industry’s best, offering an easy-to-use solution to debug the QSPI protocol activity.
Timing Diagram and Protocol Listing View

The timing view provides the plot of CS, CLK, DQO, and DQ1 signals with a bus diagram. Overlaying of Protocol bits on the digital timing waveform will help easy debugging of Protocol decoded data. Cursor and Zoom features will make it convenient to analyze Protocol in the timing diagram for any timing errors.
Setup View

Setup View of PGY-QSPI-EX-PD allows the user to configure the QSPI chip select (CS), Clock Polarity (CPOL), Clock Phase (CHPA), QSPI rate of STR or DTR, and the different modes of QSPI such as Extended, Dual or Quad.
Appendix 1

The PGY-QSPI-EX-PD unit will work for Frequencies up to 80MHz only in the below-mentioned configurations. This is also subject to the fact that the QSPI Exerciser and Protocol analyzer is connected to the DUT using a board- to board connection.
QSPI Specifications
| PGY-QSPI Specifications | Features | PGY-QSPI-EX-PD |
|---|---|---|
| Exerciser: | ||
| Configurable | 1 Master + 1 Slave | ✔ |
| QSPI Traffic Generation | Custom QSPI traffic generation Simulate real-world network traffic | ✔ |
| SCL Frequency | 100KHz to 80MHz* | ✔ |
| Voltage Drive Level | Fixed 1.8V & 3.3V | ✔ |
| SCL Duty Cycle variation | 25%, 50%, and 75% | ✔ |
| SCL & SDA Delay | User-Defined | ✔ |
| Delay between two messages | User-Defined | ✔ |
| QSPI modes supported | Extended, Dual, and Quad | ✔ |
| Transfer rate | STR and DTR | ✔ |
| API Support | Support for Automation of operation using Python | ✔ |
| Protocol Analysis: | ||
| Supports | Protocol Views | ✔ |
| Protocol Views | Timing Diagram View. | ✔ |
| Protocol Listing View. | ✔ | |
| Bus-Diagram to display Protocol packets with timing diagram plot. | ✔ | |
| Protocol Error report | Non-standard frame format | ✔ |
| Capture Duration | Continuous streaming Protocol Data to host HDD/SSD | ✔ |
| Host Connectivity | USB 3.0/2.0 interface | ✔ |
Software Interface & Analysis Views

Similar Products
-
 Protocol Exercisers & Analyzers
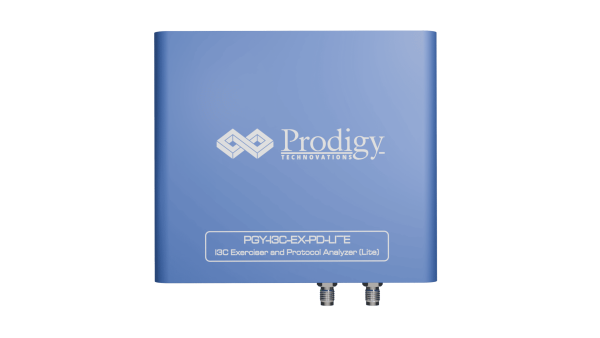
I3C Protocol Exerciser and Analyzer – Lite
The PGY-I3C Lite is a Protocol Analyzer…
-
 Protocol Exercisers & Analyzers
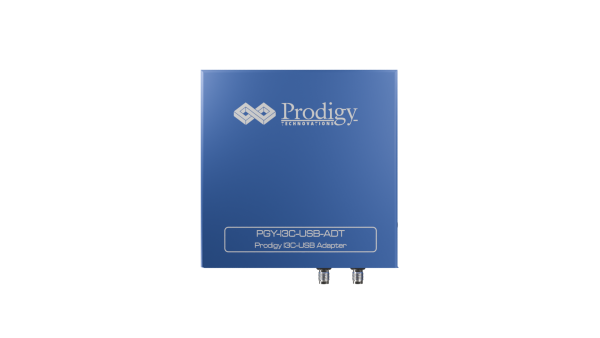
I3C USB Adapter
The PGY-I3C_USB_Adapter provides the ability to operate…
-
 Oscilloscope Based Software
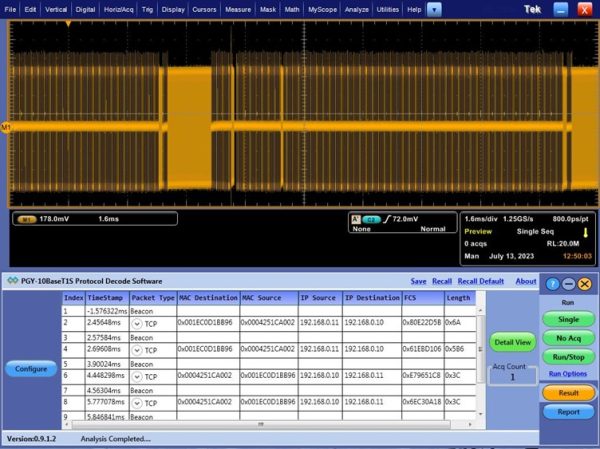
10BaseT1S Protocol Decode Software
10BaseT1 is emerging as a key interface…